Imagine this:
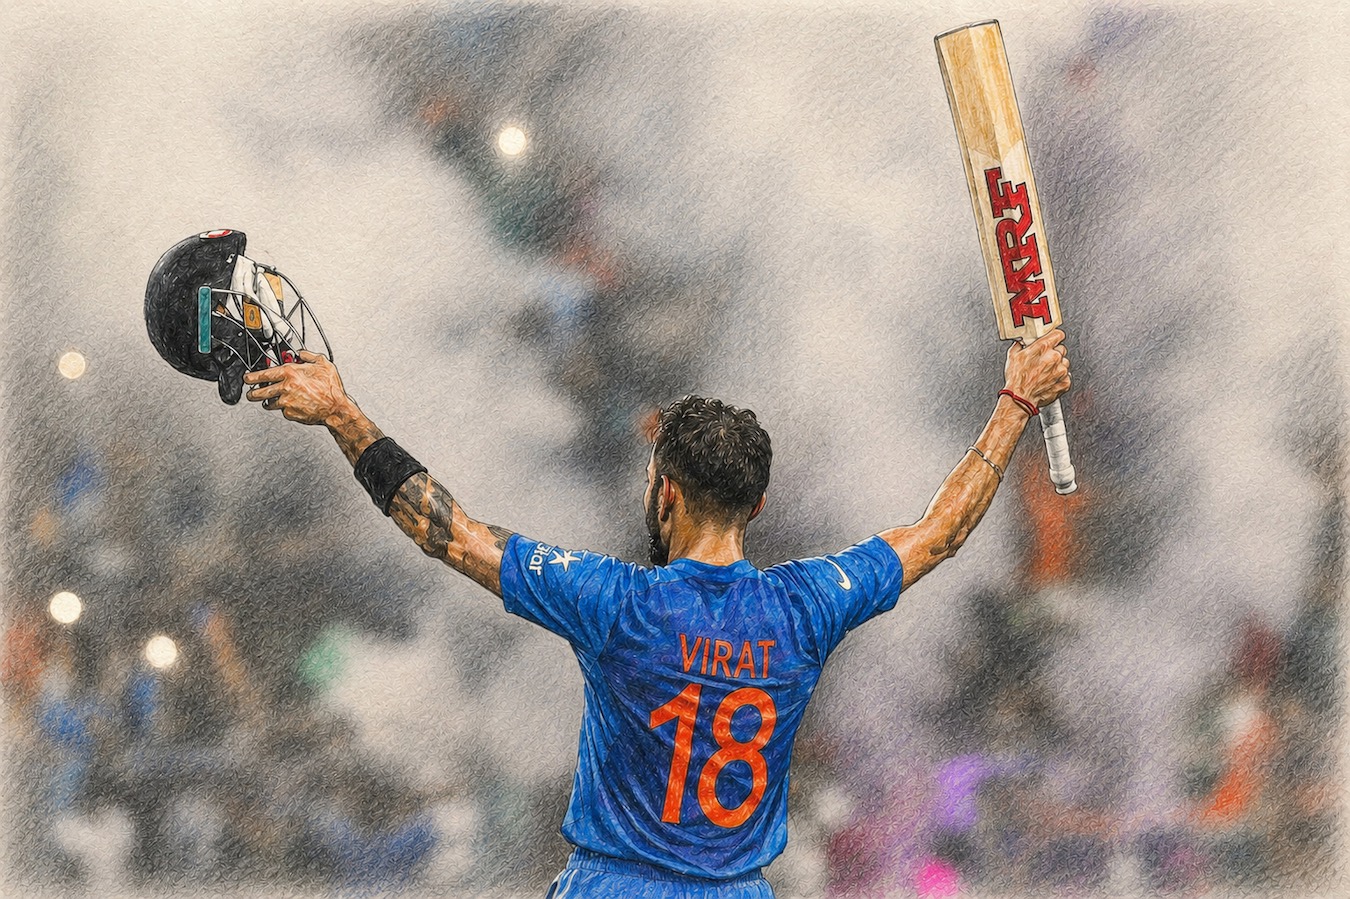
Virat Kohli scores a century. The crowd goes wild. The highlights are everywhere. Your cricket-loving friend brings it up in every conversation for the next three days. And yet, India loses the match. Strange, isn’t it? Now imagine the opposite. Virat has a forgettable day. The team, however, plays brilliantly and wins comfortably. Also possible. Because while individual performance and team performance are connected, they’re not always the same thing. Oddly enough, this is one of the easiest ways to understand local and global conservation.
Let’s leave cricket there for a moment.
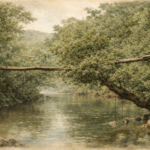
Imagine you’re looking at a map. Not the folded kind hidden in a glove compartment. Google Maps. Zoom out. Further. Further. Soon, roads disappear. Buildings disappear. Entire cities begin looking like dots. You start seeing the bigger picture. Now zoom back in. Suddenly, details begin showing up. The map hasn’t changed. Your perspective has.
Conservation works in much the same way. Let’s start with the zoomed-out view. Imagine trying to understand how wildlife across the entire planet is doing. Not just a particular species but everything. The butterfly in your garden. The frog that appears after the first rain. The bird is currently shouting outside your window as though it pays rent. How do you keep track of all that?
This is where the IUCN comes in. The International Union for Conservation of Nature is one of the world’s leading conservation organisations. It brings together scientists, researchers, governments and conservationists to better understand and protect biodiversity across the planet.
One of its most well-known tools is the Red List, which assesses species and their risk of extinction. Species are grouped into categories like Least Concern, Near Threatened, Vulnerable, Endangered and Critically Endangered. The names may sound technical, but they’re all helping answer a fairly simple question: How is this species doing?
But the IUCN’s work extends far beyond the Red List. From helping identify important ecosystems and protected areas to guiding conservation action and policy, it plays a key role in helping us understand the bigger picture of life on Earth.
And when thousands of species are assessed, something interesting happens. Patterns begin to emerge. Which species are doing well? Which ones need our attention? Which ecosystems are under pressure? This is global conservation. The view from high above. The view that helps us understand the bigger picture.
It’s a little like standing on a terrace and looking at an entire city. You can spot neighbourhoods, traffic and patterns. But you can’t tell who’s making chai.
But here’s where things get interesting… Let’s say a species is abundant. You read that its population is healthy. Its global outlook looks reassuring. Case closed? Not quite.
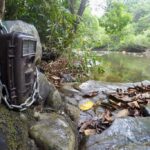
Because the next question matters just as much: Abundant where? A species can be abundant across its overall range and still be scarce in a particular landscape. A bird may be doing well globally but becoming harder to spot in a local wetland. A butterfly may be common across a country but absent from a neighbourhood where it once thrived. A frog may be abundant in one region and surprisingly scarce in another.
Suddenly, the story changes. And that’s where local conservation enters the conversation. If global conservation asks, “How is the species doing overall?” Local conservation asks, “How is the species doing in its native habitat in a particular area?”
Same species. Different question. Neither is more important than the other.
Imagine looking only at the map. You’d understand the journey, but miss the details. Now imagine looking only at the pin. You’d understand the location, but miss where it fits into the larger picture. Conservation needs both. The map and the pin. The team and the player. The forest and the tree. Because nature is rarely just one story. It’s thousands of local stories woven into a global one.
And perhaps that’s what makes conservation so fascinating. The further you zoom out, the more connected everything becomes. The closer you look, the more unique every detail appears.
Both views are true. Both views matter. And understanding the difference between them is one of the first steps towards understanding conservation better.
Perhaps the next time you see that a species is doing well, pause for a moment and remember:
Every dot on the map has a story.
And every story helps us understand the map.